Analysing and improving Blackboard test (quiz) results
This article covers using item analysis to assess student progress and the effectiveness of a Blackboard test.
What is an Item Analysis?
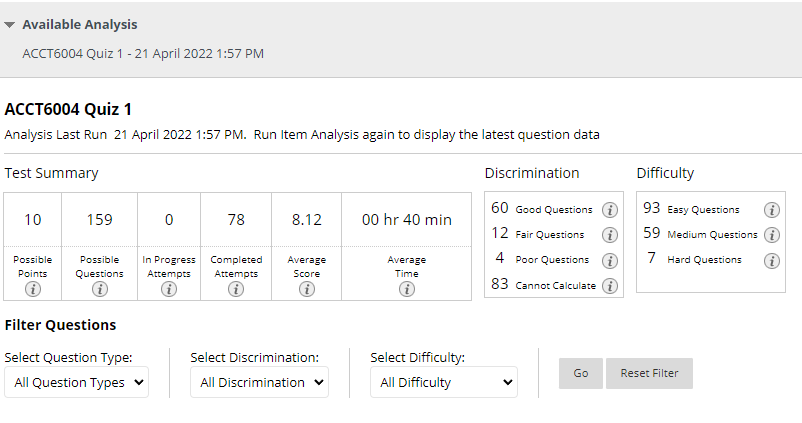
An Item Analysis is a reporting dashboard for a Blackboard test, which includes an evaluation of student performance and whether the quiz questions worked as intended. An item analysis indicates possible points and questions, in progress and completed attempts, the average score of the students and the average time to complete the test. An overview of the different Test Statistics is available at the bottom of this page.
What can an Item Analysis be used for?
- Identifying poor or challenging questions
- Identifying the most challenging concepts so that these can be addressed in class
- Reassessing test assessments prior to future testing
- Increasing/encouraging Academic Integrity
If reusing or considering reusing a quiz from a previous unit, it might be insightful to run an item analysis on the quiz before importing/copying it. This can provide valuable intel on questions to consider leaving out or editing, or content that needs to be emphasised prior to the quiz etc.
Accessing an Item Analysis for a test (quiz) in Blackboard
Once a Blackboard test (quiz) has been completed by students it is helpful to run an Item Analysis on a test. A Blackboard test needs to be located first, either through the Assessment Tasks and Submission content area, or through "Tests, Surveys and Pools" (located under Site Management > Site Tools).
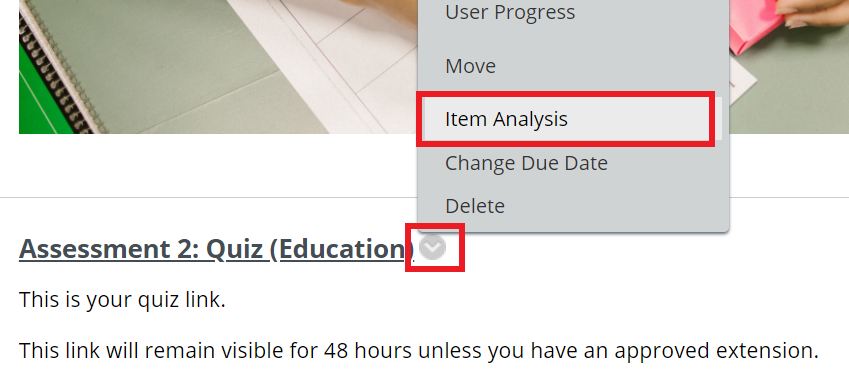
To access the Item Analysis, find the Blackboard test, then click the grey chevron arrow and click the option Item Analysis.
- To run an Item Analysis Select Test from the drop-down options, and then click Run. (Tests can be run again at a later time to assess changes.)
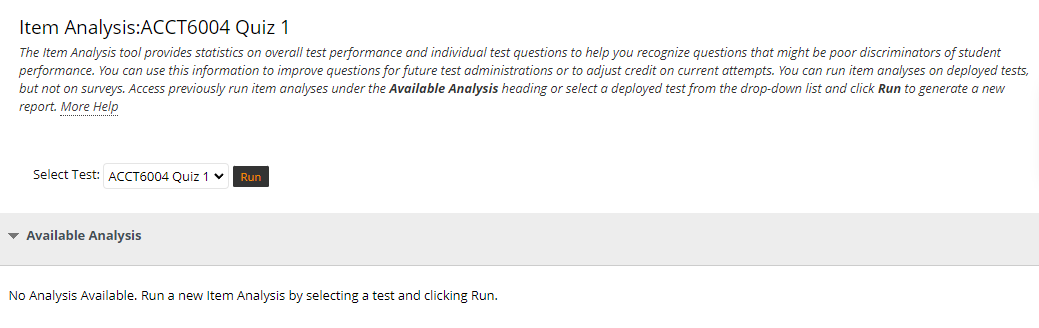
- After processing the analysis you will receive an email to notify you the analysis is ready to view. Click on the analysis title under Available Analysis to open the reporting dashboard.
Watch the video below for a more detailed overview of how to run an Item Analysis and how to use this information to improve Blackboard tests in order to enhance student learning and assessment.
The Test Summary
After an Item Analysis is run and opened, the Test Summary report dashboard appears. Below the Test Summary, there is a table that lists the results for each question. Click on an individual question to view more detailed information about that question. The interactive below explains the key features of the Test Summary.
Large cohorts provide best insights
Smaller cohorts may not provide adequate insight into responses as these are easily skewed by a particular student result. With larger cohorts, pay careful attention to the "Discrimination" and "Difficulty" columns as these provide a good insight into the validity of questions or content.
The table below explains each setting and how it is calculated.
Setting | Description |
Possible Points | The total number of points possible for the test. |
Possible Questions | The total number of questions in the test. |
In Progress Attempts | The number of students currently taking the test who have not submitted their quiz yet. |
Completed Attempts | The number of students who have completed the quiz already. |
Average Score | The average score of all the students that have completed the quiz. If question types that require manual grading are included in the quiz, an asterisk will indicate whether some attempts have not yet been graded. Once these have been graded, they might influence the average score. |
Average Time | The average time that the students spent completing the quiz. |
Discrimination | Indicates the number of questions that fall into the Good (greater than 0.3), Fair (between 0.1 and 0.3), and Poor (less than 0.1) categories. A discrimination value is listed as Cannot Calculate when the question's difficulty is 100% (no student answers the question correctly), or when all students receive the same score on a question. Questions with discrimination values in the Good and Fair categories are better at differentiating between students with higher and lower levels of knowledge. Questions in the Poor category are recommended for review. |
Difficulty | Indicates the number of questions that fall into the Easy (greater than 80%), Medium (between 30% and 80%) and Hard (less than 30%) categories. The difficulty of a question is determined based on the percentage of students who answered the question correctly. Questions in the Easy or Hard categories are recommended for review and are indicated with a red circle. |
Checking questions identified in a test summary report
Carefully check poor questions or those where a calculation cannot be made (where all students chose the same answer).
- Is the question clear and easy to understand?
- Did you expect all students to answer this question correctly/incorrectly?
- Was the question skipped by any students? (click on the question to view these detailed statistics)
It is to be expected that a few questions might be a little easy or present a challenge, but the majority of questions should not fall into this category. Ideally, there should be a good mix of easy, medium and hard questions. Also check whether the majority of students managed to complete the test in the time provided.
What makes a question hard?
A question may not necessarily be "hard", it could be that the student cohort did not study well enough for the quiz, or that the question is phrased in a way that is confusing or misleading. It is always a good idea to review hard questions to ensure they are appropriate.
Further resources
More information about Item Analysis is available via Blackboard Help: Item Analysis